UniBind Documentation
Last updated: July 13, 2020
What is UniBind?
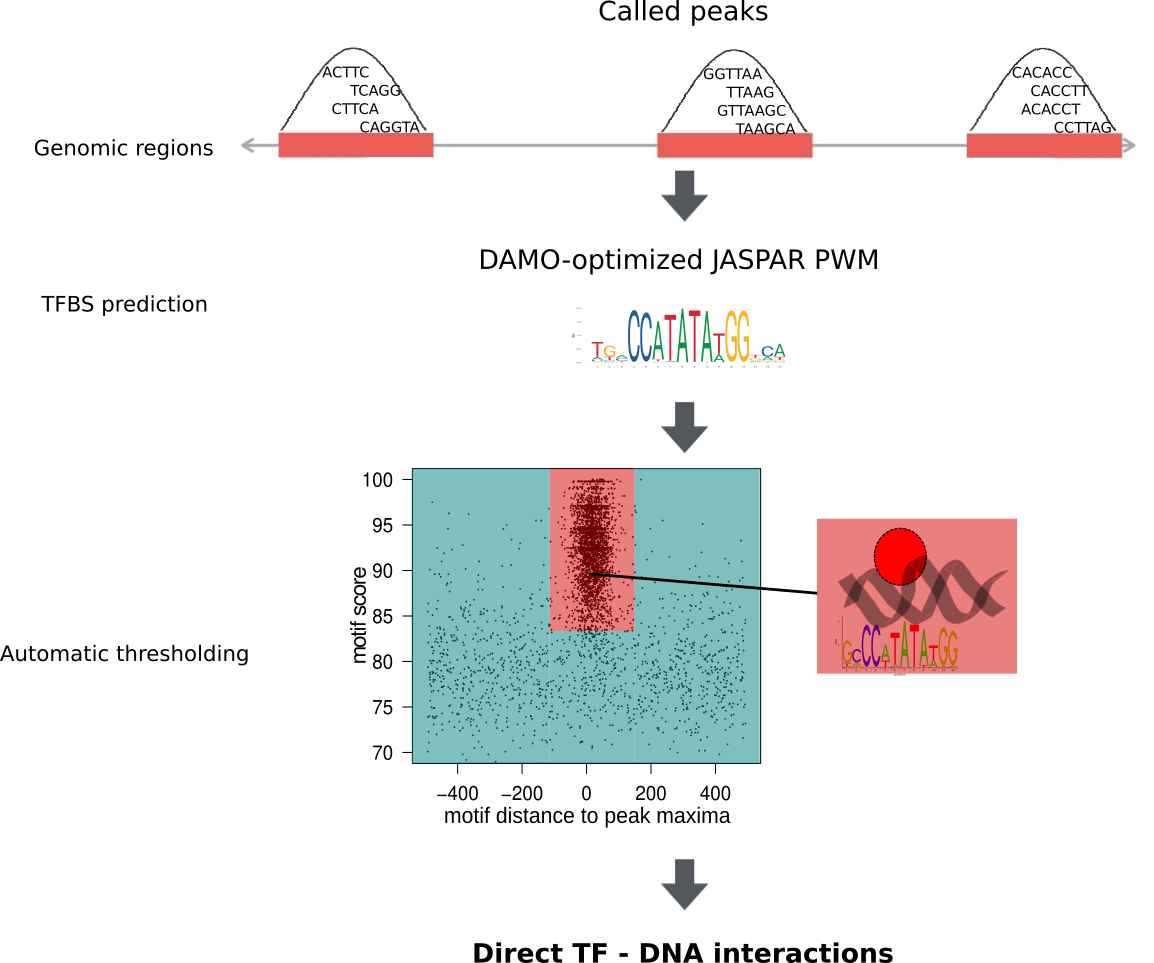
UniBind is a comprehensive map of direct transcription factor (TF) – DNA interactions in the genome for nine different species. These interactions were obtained from thousands of ChIP-seq data sets obtained from ReMap and GTRD. From these resources, we obtained MACS2-called peaks. Next, these genomic regions were analysed with DAMO-optimized Position Weight Matrices (PWMs) to predict direct TF-DNA interactions. An entropy-based algorithm was used on the best subsequence per peak to automatically delineate an enrichment zone containing direct TF – DNA interactions, supported by both strong computational evidence and strong experimental evidence. Finally, all peaks that did not fall within the enrichment zone were rescanned to detect any subsequence different from the best one that would fall within the enrichment zone.
Datasets in UniBind are separated into robust and permissive collections based on two quality control metrics. First, we filtered out datasets where the DAMO-optimized TF binding motif was not similar to the expected canonical motif. Second, we filtered out datasets where TFBSs are not enriched around their summits. Datasets satisfying both criteria were classified as part as the robust collection, while the rest were classified as part of the permissive collection.
The UniBind database hosts the complete set of TFBS predictions, as well as the prediction model itself and cis-regulatory modules derived from these direct TF – DNA interactions. All the data is publicly available. For further details, please refer to the associated publications:
R. Riudavets Puig, P. Boddie, A. Khan, J.A. Castro Mondragon, A. Mathelier,
UniBind: maps of high-confidence direct TF-DNA interactions across nine species.
BMC Genomics 22, 482 (2021).
https://doi.org/10.1186/s12864-021-07760-6.
M. Gheorghe, G.K. Sandve, A. Khan, J. Cheneby, B. Ballester, and A. Mathelier,
A map of direct TF-DNA interactions in the human genome.
Nucleic Acids Research (2019) gky1210
https://doi.org/10.1093/nar/gky1210.
How was the data processed?
The entire collection of ChIP-seq data sets was processed by ReMap and GTRD up to ChIP-seq peak calling and is available at its respective databases. The peaks were used as input for the ChIP-eat data processing pipeline. The complete pipeline is designed to uniformly process ChIP-seq data sets, from raw reads to the identification of direct TF-DNA binding events, and it was implemented in the ChIP-eat software with source code freely available at our BitBucket repository. Specifically, ChIP-eat allows for: (i) aligning and filtering raw ChIP-seq data, (ii) calling ChIP-seq peaks, (iii) training the TFBS computational model and (iv) automatically defining the enrichment zone in the landscape plots to predict TFBSs. Only the ChIP-seq datasets for which a TF binding profile for the targeted TF was available in JASPAR were used for TFBS predictions. For each peak, we computed the best subsequence as the one minimizing the distance to its peak summit and maximizing its score. With these subsequences, the enrichment zone containing high confidence direct TF-DNA interactions was automatically defined for each data set using an entropy-based algorithm. Next, we rescanned all peaks falling outside the enrichment zone to look for any subsequence different from the best that would still allow the peak to be within the enrichment zone.
Datasets in UniBind are separated into robust and permissive collections based on two quality control metrics. First, we filtered out datasets where the DAMO-optimized TF binding motif was not similar to the expected canonical motif. Second, we filtered out datasets where TFBSs are not enriched around their peak summits. Datasets satisfying both criteria were classified as part as the robust collection, while the rest were classified as part of the permissive collection.
What data does UniBind host?
The UniBind database contains millions of transcription factor (TF) binding site (TFBS) predictions across the genome of nine different species. These predictions were derived from the uniform processing of 9625 publicly available ChIP-seq datasets accounting for 837 distinct TFs in 1329 cell lines. For each ChIP-seq data set, the user can download the following: the set of predicted direct TF-DNA interactions in BED6 format, and in FASTA format, a visual representation of the delineated enrichment zone, and the trained prediction model used.
What does each entry in UniBind contain?
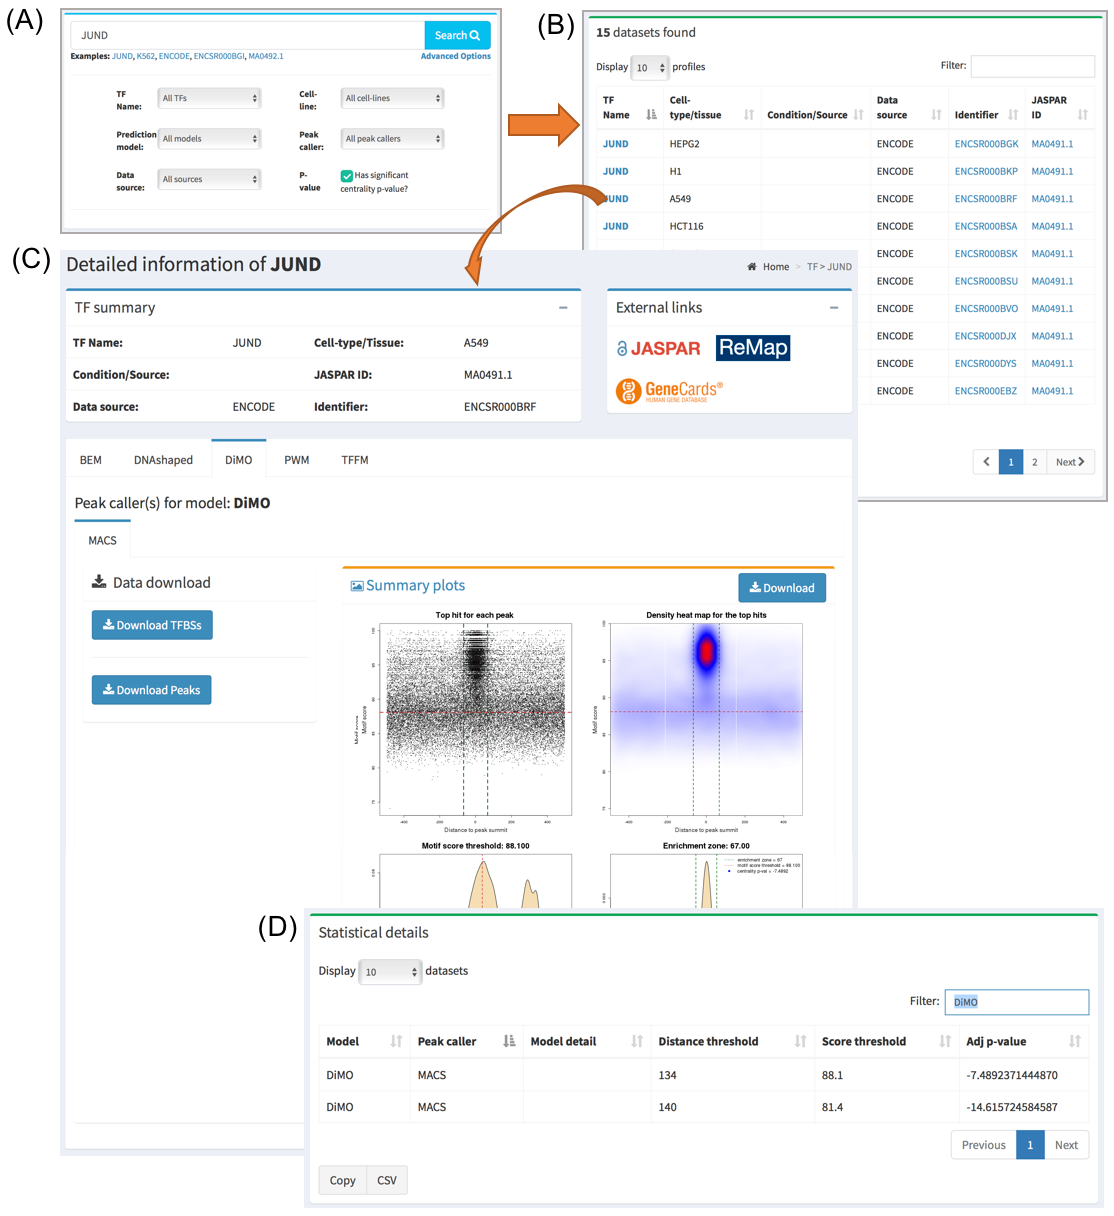
When searching/clicking on one TF name or one ChIP-seq data set of interest, a page will be displayed with all the information available. A summary part is at the top of the page describing the metadata available for that dataset. The user is also provided with external links pointing for more details about this entry’s components.
On the middle section of the page, all the JASPAR matrices used for this database entry are displayed in a tabbed layout. Download buttons are also available in this section from where the user can obtain the set of TF binding site predictions. At the bottom of this section, a plot consisting of four panels is displayed to give a visual representation of the data for the selected JASPAR matrix. Please see next section in the documentation on how to interpret these plots.
Below this section, a summary of the statistics for all the prediction models used for this data set is displayed. Namely, the thresholds that define the set of direct TF-DNA interactions are displayed, as well as a CentriMo p-value providing information about the centrality of the predictions with respect to the ChIP-seq peak summits. The lower the p-value the stronger the centrality. The closer it is to 0 the lower the quality of the data and/or performance of the prediction model is on this particular data set.
Finally, at the bottom of the entry page, suggestions with other ChIP-seq data sets targeting the same TF are available.
How can I download the data?
The user can download the set of transcription factor binding sites (TFBSs) and the trained prediction model for each of the datasets individually by navigating to the UniBind entry of interest. If the user wants to download the available data in bulk, this can be done through the Download section of the UniBind database. For the TFBS bulk download, BED and FASTA files are available. In case of TFs with variants (e.g., TFAP2C, JUND), individual files are available for each variant. This section also allows the user to download the cis-regulatory modules derived using the entire set of TFBS predictions.
How to interpret the enrichment zone and centrality p-value?
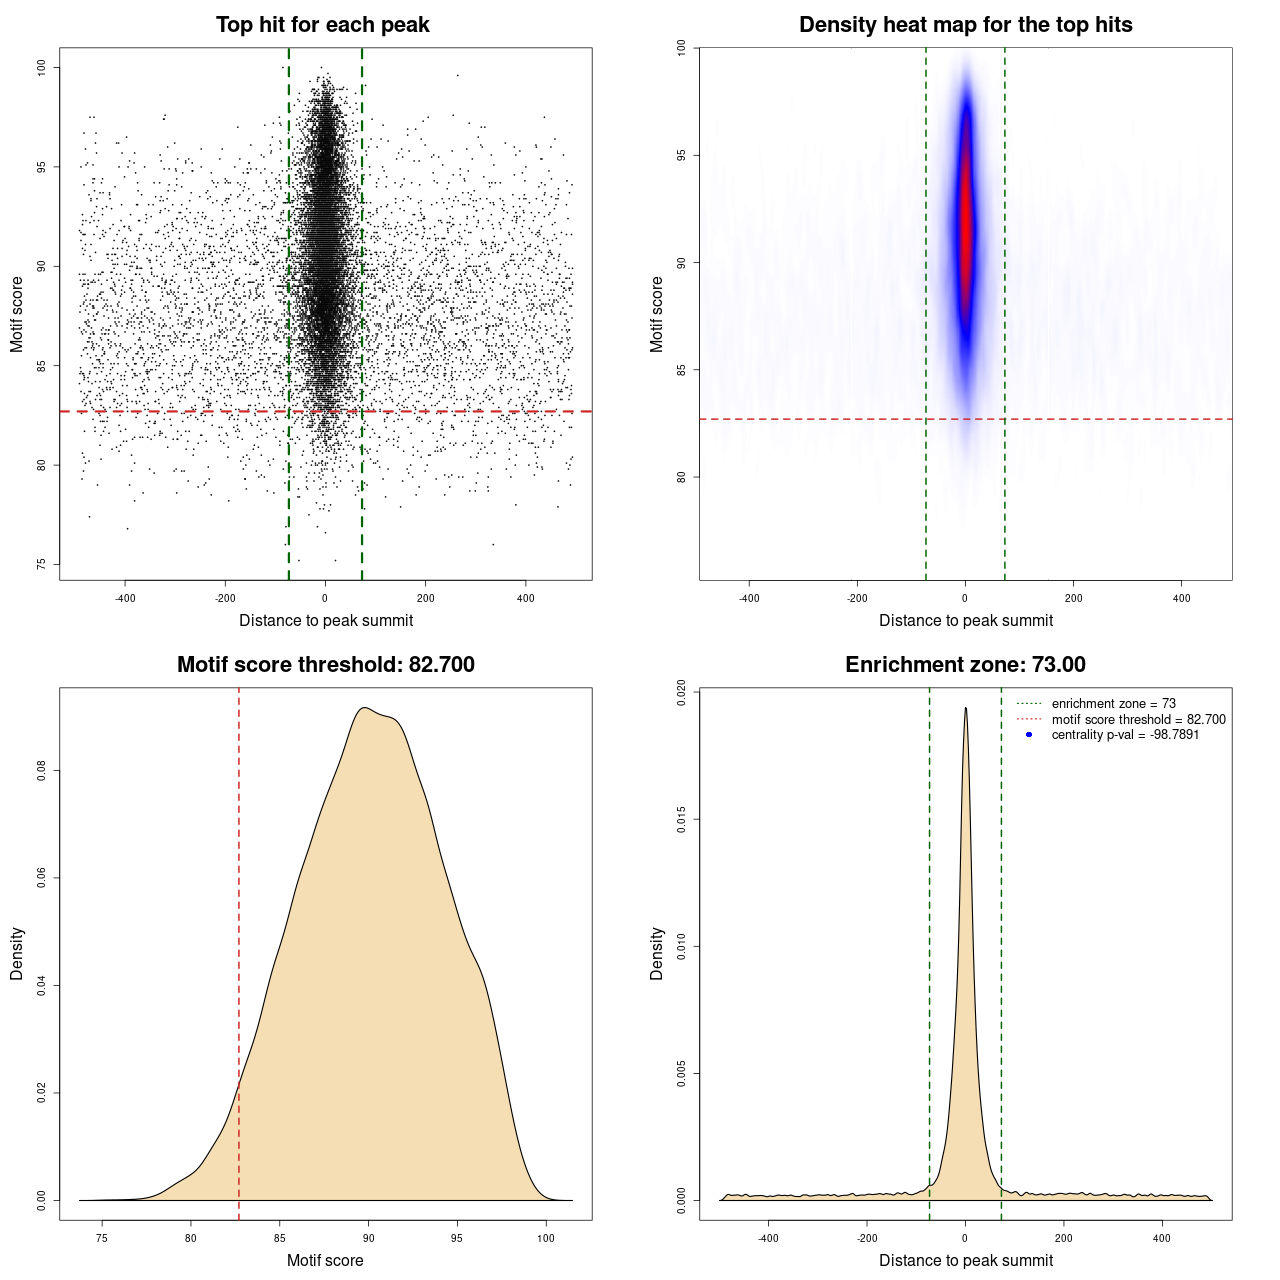
For each entry in UniBind, a visual representation of the results is available. It consists of a plot composed of four panels. Each point in panel (A) represents the top scoring sequence in one ChIP-seq peak, that is the sequence within the ChIP-seq peak with the best score computed from the TFBS computation model used. On the Y-axis is the motif score, and on the X-axis is the distance to the ChIP-seq peak summit. The dashed lines represent the thresholds on the TFBS computational model scores and on the distance to the peak summits, delimiting the area that contains direct TF-DNA interactions. Panel (B) is a heat map of the data from panel (A) to help in visualizing the density of the data and better understand the defined thresholds. The bottom panels show where the threshold on the motif score (C) and on the distance from the peak summit (D) was automatically defined by the entropy-based algorithm. In the legend of panel (D) the centrality p-value is provided. The closer it is to 0 the lower the quality of the data and/or performance of the prediction model is on this particular data set.
How to use advanced search?
The user can perform an advanced search of the data available in UniBind. Entering the Search page by clicking “Search” on the top of the page, an “Advanced Options” link is available under the search bar. Here, the user can select the TF of interest, the cell-line of interest, as well as the preferred species, data source, and collection. It is also possible to filter the results by centrality score (log10(p-value)) of the enrichment zone by checking the option P-value. This will display a text field where users can introduce a desired threshold to filter the search results, where only datasets with a centrality score lower than the introduced threshold will be shown. Once the desired options are selected, the user can click the search button, and come back to modify those options at any time during the browsing. The diagram below illustrates the use of advanced search: